
The Periodic Table Predicts How an Element Behaves Before You Look It Up
A guide to the periodic table that treats it as a map: read one box, find its row and column, and predict how an unfamiliar element behaves.
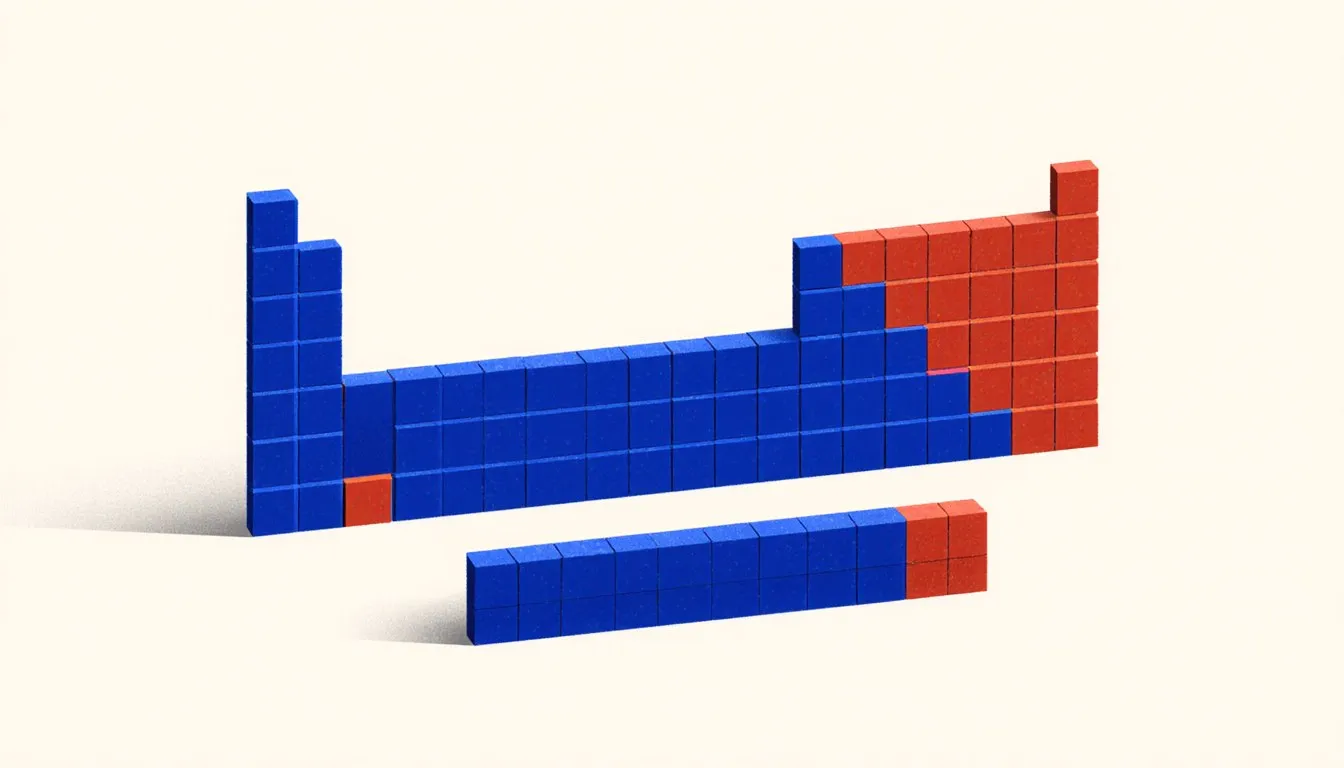
Point at cesium in the bottom left of the table, then at neon over on the right. You can call what each one does in water before you know anything else about either. Cesium reacts hard enough to be a genuine hazard. Neon does nothing at all. Position told you that. Every element sits where it sits because of how its atoms behave, which makes the periodic table a map of chemical behavior, and like any good map, it repays reading far more than memorizing.
Most people leave school carrying a different impression: that the table is the elements lined up by weight, a chemical phone book with the light ones at the front and the heavy ones at the back. That reading survives about ten seconds of contact with the actual table. If weight were the organizing rule, the columns would be meaningless, and the columns are the entire point. What follows is a walk through the whole thing at map altitude: one box, then the rows, then the columns, then the families, then what you can predict from a coordinate alone.
What is the periodic table actually showing you?
The table shows you the outermost electrons of every known element, sorted so that atoms with similar outer-electron arrangements end up stacked in the same column. Chemistry happens almost entirely at that outer edge. Nuclei sit in the middle, heavy and mostly uninvolved, while the outermost electrons do the reacting, the bonding, the conducting, and the burning. Sort by those electrons and you have sorted by behavior.
The word “periodic” is doing real work in the name. As you walk left to right along a row, properties change steadily: metallic character falls off, reactivity dips in the middle and climbs again near the right edge, and then at the far right the row ends with an element that refuses to react. Start the next row and the whole pattern repeats. Properties recur at regular intervals, which is what periodicity means, and the table is simply that repeating pattern folded into a grid so the repeats line up vertically.
There are 118 confirmed elements, arranged in 7 rows and 18 columns, with two extra rows parked underneath in most printed layouts. The International Union of Pure and Applied Chemistry, IUPAC, is the body that confirms new elements, approves their names, and settles arguments about where things belong. Their group numbering, 1 through 18 straight across, is the one to learn. Older charts use Roman numerals plus two lettering systems that disagree with each other, and untangling those is a waste of a perfectly good afternoon.
Here is the practical payoff. Handed an unfamiliar symbol, you do not need to have memorized anything about it. Find the box, note the row and the column, and you can say with reasonable confidence whether it is a metal, roughly how eagerly it reacts, what charge its ion tends to carry, and which other elements it will behave like. That is how working chemists think about elements they have never handled.
Who arranged the elements this way, and why did it stick?
Dmitri Mendeleev published his version in 1869, and the reason his stuck while several near-contemporaries faded is that he trusted the pattern more than he trusted the data. Arranging the known elements by increasing atomic weight, he noticed properties repeating, and when an element with the right weight did not have the right properties, he left an empty square rather than forcing a bad fit. Then he did the thing that turned a filing system into a scientific instrument: he described what the missing elements would be like. He gave predicted densities, predicted melting behavior, predicted the formulas of their oxides.
Gallium arrived in 1875 and matched. Scandium arrived in 1879 and matched. Germanium arrived in 1886 and matched closely enough that the argument was effectively over. Three predictions, three confirmations, all within seventeen years, and each one specific enough that a wrong table would have been caught immediately. The empty squares had done what a table of known facts could never do: they pointed chemists at where to dig, and told them what they would find when they got there.
Mendeleev’s table did have a flaw he could not explain, and it bothered him. A few pairs came out in the wrong order by weight. Tellurium is heavier than iodine, yet tellurium clearly belongs with the elements above it and iodine clearly belongs with the halogens, so he swapped them and took the criticism. The fix came in 1913, when Henry Moseley measured the X-rays emitted by different elements and found that their frequencies stepped up in a clean, whole-number sequence. That number turned out to be the count of protons in the nucleus. Order the table by proton count instead of weight, and every awkward swap resolves itself. Isotopes explain the rest. Tellurium’s average mass runs high because of which isotopes happen to be common. Its proton count is 52, and that puts it exactly where its chemistry says it should be.
The last major renovation came in the 1940s, when Glenn Seaborg proposed pulling the actinides out of the main body and setting them in their own row beneath the lanthanides, on the grounds that they were filling the same kind of electron subshell. He was reportedly warned it would ruin his reputation. It did not. If you want the full sequence of false starts, rival arrangements, and the alchemical glyphs that preceded Berzelius’s tidy letter symbols, the history of periodic table has the long version.
How do you read a single element’s box?
Every box carries the same four pieces of information, and each one counts something physical:
- The atomic number, usually top left or top center, is the number of protons in the nucleus. This is the element’s identity and it is not negotiable. Six protons is carbon. Add one proton and you have nitrogen, a different substance entirely.
- The symbol, one or two letters, first capitalized and second lowercase. Some are obvious (C, O, Ca), and some come from Latin or German names that outlasted the English ones: Na for natrium, Fe for ferrum, Pb for plumbum, Au for aurum, W for wolfram.
- The name, which on many charts is the first thing to disappear when the design gets crowded.
- The atomic mass, the decimal number underneath, which is the weighted average mass of that element’s naturally occurring isotopes.
That last one causes more confusion than the other three combined, because students reasonably expect a mass to be a mass. Chlorine is listed at about 35.45, and there is no chlorine atom anywhere in the universe weighing 35.45 units. What exists is chlorine-35 and chlorine-37, in a mix of roughly three parts to one, and 35.45 is the average of that population. Think of it as a class average rather than any student’s score. The analogy breaks down in one useful way: a class average shifts as students come and go, while the isotope ratio for a given element is remarkably steady wherever on Earth you sample it, which is exactly why a single printed number is worth anything.
A few boxes show the mass in square brackets. That means the element has no stable isotope, so there is no natural mix to average, and the bracketed figure refers to the longest-lived isotope known. Every element past bismuth carries brackets, along with technetium and promethium sitting oddly in the middle of the table. Charts vary in what else they cram in: some add electron configuration, some add common ionic charges, some add melting points. A chart built around a periodic table with atomic mass is the one you want for stoichiometry homework, while a periodic table with charges saves time when you are writing ionic formulas.
What do the rows and columns actually mean?
Rows are called periods and they track electron shells. Period 1 has two elements because the first shell holds two electrons and then it is full. Period 2 has eight, period 3 has eight, then the rows jump to 18, 18, 32, and 32. Each jump marks a point where a new type of subshell becomes available and has to be filled. That is where the table gets its shape: a tall block on the left, a wide block in the middle, and two orphaned rows underneath.
Columns are called groups, and they track valence electrons, the electrons in the outermost occupied shell. Group 1 elements have one. Group 2 have two. For groups 13 through 18, subtract ten and you have the count: group 17 elements have seven valence electrons, group 18 have eight, and a full outer set of eight is chemically the most comfortable arrangement an atom can have. That rule of eight has a limit at the very top of the table, where the first shell holds only two: helium sits in group 18 with two valence electrons and is as complete as any element on the chart. The heavier end frays too, since elements from period 3 down can hold more than eight around them, which is how sulfur hexafluoride exists at all. That single fact explains most of the reactivity on the table. Group 1 has one electron more than a stable arrangement and gives it up eagerly. Group 17 is one short and takes one just as eagerly. Group 18 already has the full set and does essentially nothing, which is why the noble gases were the last major family discovered: they leave no chemical fingerprints.
Picture the shells as rows of seats in a theater, filling from the front. It is a serviceable image for a first pass, and it tells you honestly why period number matters, since a period 4 element is working with a shell four rows back from the nucleus. Then the image breaks, and it is worth knowing where. The seats do not fill in strict order. The fourth-shell s subshell fills before the third-shell d subshell, which is precisely why the transition metals interrupt the table where they do. Actual electron behavior is a probability cloud rather than a seating chart, and the arrangement of those clouds is the whole reason the grid has its shape. For the box-by-box detail, use an electron configuration chart for all the elements, and pick up the shorthand chemists use to skip the boring inner electrons under noble gas configuration.
Hydrogen deserves a note, because it is the element that refuses to sit still. It has one valence electron, which argues for group 1, but it is a colorless gas that behaves nothing like sodium. Most tables park it above group 1 and quietly hope nobody asks. Some print it floating alone. There is no fully satisfying answer, and honest charts show the seam rather than hiding it.
What are the main families, and what makes each one act the way it does?
Families are columns or blocks whose members share a valence arrangement and therefore share behavior. Here is the tour at speed, with the mechanism attached to each, because a family described without its mechanism is just a list of names to forget.
Alkali metals (group 1)
One valence electron, loosely held, given away at the slightest provocation. That makes them the most reactive metals on the table, soft enough to cut with a knife, and light enough that lithium floats on water while reacting with it. Reactivity climbs as you go down, because the lone electron sits further from the nucleus each row and is held more weakly. They are stored under oil because air and moisture attack them on contact. The sodium-in-water demonstration is a teacher demonstration, done in small quantity behind a safety shield with goggles on, and it does not belong in a kitchen under any circumstances. The full behavior picture is in alkali metals properties, and the industrial side, from lithium cells to sodium vapor lamps, is covered in uses of alkali metals.
Alkaline earth metals (group 2)
Two valence electrons, given up as a pair, producing the 2+ ions that show up everywhere in the natural world. Calcium builds bone and limestone, magnesium sits at the center of every chlorophyll molecule, and barium is dense enough to be useful in medical imaging. They are harder and higher-melting than their group 1 neighbors, and less violently reactive, because pulling two electrons away takes more energy than pulling one.
Transition metals (groups 3 through 12)
The wide block in the middle, and the reason your world is built the way it is. Their defining trait is that electrons in two different subshells are close enough in energy to both participate in bonding, which gives them multiple oxidation states. Iron can be 2+ or 3+, copper 1+ or 2+, manganese runs through a whole range. That flexibility is why they make superb catalysts, why their compounds are so often colored, and why they alloy so well with each other. They are dense, strong, and high-melting: tungsten holds out to roughly 3,400 degrees Celsius before it melts, which is why it spent a century as a light bulb filament. The uses of transition metals goes through the applications properly.
Metalloids and the post-transition metals
Along the staircase that steps down from boron toward the bottom right sit the elements that cannot commit. Boron, silicon, germanium, arsenic, antimony, and tellurium have properties partway between metals and nonmetals, and semiconductor behavior is the practical consequence: they conduct, but only under the right conditions, which is a property you can switch. That switchability is the physical basis of every transistor ever made. The metalloids in the periodic table page sorts out the border cases, and the uses of metalloids covers where they end up.
Chalcogens (group 16)
Six valence electrons and a strong appetite for two more, which is why oxygen is such an aggressive oxidizer and why sulfur turns up in so many minerals paired with metals. The family runs from oxygen, a gas you need every few seconds, down through sulfur and selenium to tellurium and polonium, growing more metallic and considerably more toxic as it descends. The characteristics of chalcogens page walks the family in detail, and the uses of chalcogens covers the applied end.
Halogens (group 17)
Seven valence electrons, one short of a full set, and the most reactive nonmetals on the table as a direct result. Fluorine is the most aggressive element there is; chlorine is a toxic gas that also, bound into sodium chloride, sits on your dinner table; bromine is one of only two elements that are liquid at room temperature; iodine is a solid that sublimes into a violet vapor. Watching a column change state as you read down it is one of the more satisfying things the table does. Their reactivity is also a safety matter in ordinary life: chlorine-releasing cleaners should never be combined with other household products. For the group in full, start with the halogen family and the characteristics of halogens, check the halogens properties page for the physical data, and read the halogen cycle for the atmospheric side.
Noble gases (group 18)
A complete valence shell, nothing to gain, nothing to give, and therefore almost no chemistry at all. They were missed entirely by the early table-builders for that reason. “Almost” is the honest word, though: since the 1960s chemists have coaxed xenon into forming real compounds with fluorine, which was a genuine surprise and remains a small, well-defined body of chemistry rather than a footnote to be waved away. Their inertness is what makes them useful, filling incandescent bulbs, shielding welds, and insulating double-glazed windows. The properties of noble gases page has the rest of the family.
Inner transition metals (the two bottom rows)
The lanthanides and actinides, pulled out of the main body to keep the printed table from becoming three feet wide. They fill f subshells, which are buried deep enough that the elements within each row barely differ chemically, and that similarity is exactly why separating rare earth elements from one another is such difficult industrial work. The actinide row is where the table turns radioactive across the board. Inner transition metals covers both rows.
What can you predict just from where an element sits?
Four properties change in orderly ways across the table, and once you have the direction of each in your head, you can compare any two elements without a reference book.
Atomic radius shrinks as you go left to right along a period, and grows as you go down a group. The shrinking surprises people, since you are adding electrons the whole way across. The nucleus is adding protons at the same rate, though, and those extra protons pull the whole electron cloud in tighter while the electrons are all going into the same shell. Going down a group, you start a whole new shell, and size jumps accordingly.
Ionization energy, the energy needed to strip one electron away, moves opposite to size. It climbs left to right, because a smaller atom holds its outer electrons closer and more firmly. It falls going down, because the outermost electron sits further out, and every filled shell beneath it screens it from the nucleus. That screening is the shielding effect, and it is the mechanism sitting underneath nearly every trend on this page. Without it, chemistry would be a much duller subject and the columns would not repeat.
Electronegativity, an atom’s pull on shared electrons in a bond, rises toward the top right. Fluorine tops the Pauling scale at 3.98 and nothing else comes close; cesium and francium sit at the bottom, below 0.8. The difference between two elements’ values tells you what kind of bond they will make, which is the single most useful number-driven prediction on the whole table. The values themselves are worth having in front of you, and an electronegativity chart is the place to read them off.
Metallic character runs the other way, strongest at the bottom left and weakest at the top right, which follows directly from ionization energy: an element that gives up electrons easily behaves like a metal.
All four are trends, not laws, and they have documented exceptions where subshell structure interferes. That does not make them less useful. They tell you the direction, which is usually what you actually need, and close only counts in horseshoes and estimation. The full page on periodic table trends works through each one with the exceptions named.
How do you tell metals, nonmetals, and metalloids apart at a glance?
Find the staircase. On nearly every printed table there is a heavy zigzag line stepping down and to the right, starting between boron and aluminum and descending toward astatine. Metals are to its left, nonmetals to its right, and the elements touching the line itself are the metalloids. More than three quarters of the elements are metals, which means the left-and-center bulk of the table is shiny, conductive, malleable material and the nonmetals are crowded into a small territory in the upper right.
Aluminum is the classic trap. It sits right against the staircase and looks like it should be a border case, but it is a straightforward metal, which is easy to verify with a roll of kitchen foil. The staircase is a drawn convention rather than a physical boundary, and different publishers place polonium and astatine on different sides of it. Those elements genuinely sit on the fence, and each publisher has picked a side.
What the classification buys you is bonding. Metal plus nonmetal usually gives an ionic compound: electrons transfer outright, ions form, and you get something with a high melting point that dissolves into conductive solution. Sodium and chlorine, opposite ends of period 3, are the textbook case. Nonmetal plus nonmetal gives a covalent compound, with electrons shared rather than handed over, and generally lower melting points and no conductivity. Metal plus metal gives a metallic bond, a shared pool of electrons drifting through a lattice of positive cores, which is why metals conduct electricity and heat and why you can hammer them flat instead of shattering them. Three categories, three bonding behaviors, and a sight-reading rule that gets you to the right one before you have written anything down.
What is the periodic table actually used for outside a classroom?
The question every science teacher hears by the second week, and it has a concrete answer. Chemists use the table to predict reaction products and to balance equations, since group position tells you the charge an ion will carry and therefore the formula a compound will take. That is the daily use, and it is not a small one.
Materials scientists use it to choose substitutes. Doping silicon with a phosphorus atom, one group to the right, adds a spare electron to the crystal; doping it with boron, one group to the left, leaves a gap where an electron ought to be. Those two deliberate defects, chosen entirely by position, are the n-type and p-type semiconductors that every chip is built from. When a metal becomes scarce or expensive, the first place engineers look for a replacement is the neighboring boxes.
Medicine relies on the same column logic, sometimes in ways nobody wanted. Radium sits two rows below calcium in group 2, past strontium and barium, so a body treats radium the way it treats calcium and files it into bone, which is what made the radium dial painters of the 1920s so tragically instructive about internal radiation exposure. The same principle works in the useful direction: barium’s group 2 chemistry keeps barium sulfate insoluble enough to pass through the digestive tract while its density makes it opaque to X-rays. Platinum’s coordination chemistry underlies cisplatin, gadolinium’s magnetic behavior underlies certain MRI contrast agents. These are descriptions of how the substances work, not guidance for anyone’s treatment; that conversation belongs with a doctor.
Industry sorts its raw materials the same way, from potassium and nitrogen in fertilizer to the transition metal catalysts running refineries. The rundown of what the periodic table is used for goes further than a summary can.
Are there elements humans made rather than found?
Twenty-some of them, and the table’s right-hand end is still under construction. Technetium came first, in 1937, filling one of the gaps Mendeleev had left at number 43. Nobody had found it in nature because it has no stable isotope; every technetium atom the Earth started with decayed long ago. It had to be built in a laboratory before anyone could confirm the prediction was right.
Everything past uranium is synthetic in practice, with trace amounts of neptunium and plutonium turning up in uranium ores where natural neutron capture has done the work. Beyond that, the elements are made in accelerators by firing one nucleus at another and hoping the two stick together for long enough to be detected. “Long enough” gets shorter as the numbers climb. The heaviest elements are confirmed on the evidence of a handful of atoms with half-lives measured in milliseconds, identified by their decay chains rather than by anything you could hold in a jar. Nihonium, moscovium, tennessine, and oganesson completed the seventh row when IUPAC approved their names in 2016.
Element 118, oganesson, is named for Yuri Oganessian, one of the few people to have an element named after them while still alive. Glenn Seaborg got the same honor in 1997, two years before his death, and seaborgium went onto the chart while he could still order stationery with it printed on. Meitnerium, next door but one, is named for Lise Meitner, who worked out the physics of nuclear fission and was left off the Nobel that followed it. The page on synthetic elements covers how they are made, and the list of radioactive elements sorts out which ones are unstable and how badly, a category that includes several you will meet long before you reach the bottom of the table.
Where can you get a table worth keeping on the wall?
The chart that helps you is the one that answers the questions you actually ask. If you are learning the names, get a labeled periodic table of elements with names rather than a symbols-only design, because “Sb” tells a beginner nothing and “antimony” tells them a great deal. If you are working problems, you want atomic masses to at least two decimal places and enough space around each box to write in. If you are building formulas, common charges printed in the corner will save you real time.
Colour coding by family is the feature worth paying attention to. A chart that shades the alkali metals, halogens, noble gases, and transition metals in distinct colours turns the family structure into something you absorb by looking rather than by reciting. Check where the chart puts the lanthanides and actinides too; the standard 18-column layout drops them into two footnote rows, which is fine as long as you know the little “57 to 71” markers mean those rows genuinely belong up in the main body. A printable periodic table of elements with names is the simplest way to end up with a study copy that survives being written on, and the collection of periodic table facts is where the oddities live. There is also a steady supply of funny periodic table puns out there, which every chemistry classroom eventually acquires whether the teacher approves or not.
Once the map makes sense, ordinary objects start reporting their coordinates. The salt on your food is group 1 and group 17, the two most reactive families on the table, locked into the most placid compound in your kitchen. The window beside you may well have argon between its panes, doing nothing on purpose. The stainless steel in your sink is iron with chromium and nickel borrowed from three adjacent boxes in the transition block. Find one element in the room, locate its square, and read its neighbors. That is the whole skill, and it works from the first day you try it.
Nora Whitfield
Staff Writer
Nora Whitfield taught high-school chemistry and physics for twenty-eight years, and she has never once answered "when will I use this?" with a sigh. She believes any honest question about how the world works deserves an answer that is both correct and actually understandable.