Weather Is Four Numbers, and We Have an Instrument for Each One
How weather works and how we measure it: the four ingredients behind every storm, the instrument that pins down each one, and how readings become a forecast.
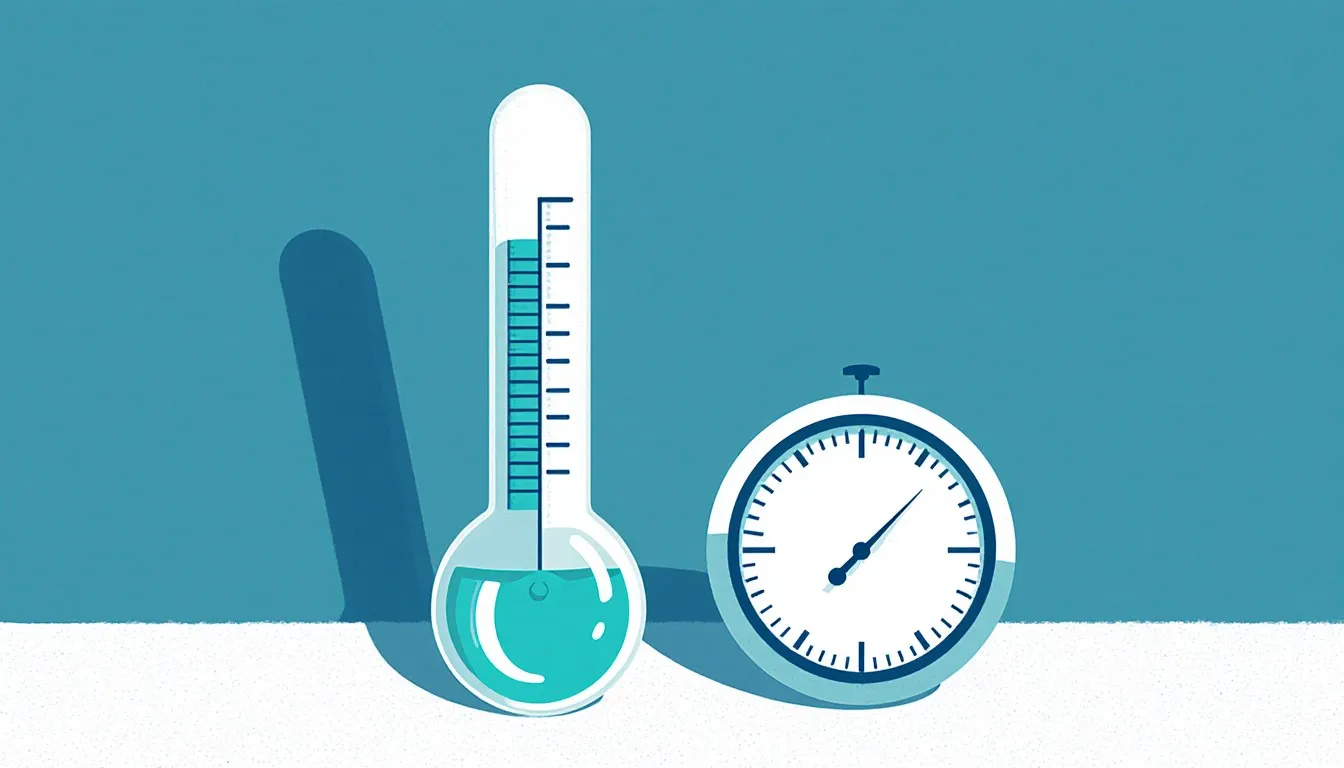
The barometer on my classroom wall used to drop about ten millibars in an afternoon, and by the next morning it would be raining. Weather is the state of four measurable quantities in the air above you at a given moment: temperature, air pressure, humidity, and wind. Every storm, every clear October morning, every miserable August afternoon is those four numbers arranged in a particular way, and each one has an instrument built specifically to pin it down. Learn what the four are and how they push on each other, and a weather report stops being a set of announcements and becomes a set of readings you can interpret.
That covers the subject in one paragraph. The rest of this is how each piece works, what the instrument in the shelter is doing, and why the numbers change.
What is weather, really?
Weather is what the atmosphere is doing right now, at your particular patch of ground. Climate is what it usually does there over decades. The distinction sounds pedantic until you notice how often it gets muddled: a cold week in April says nothing about climate, and a warm decade says nothing about whether you need a jacket on Tuesday. Same air, two very different timescales, and two very different sets of measurements.
The atmosphere is a fluid. Hold onto that above every other fact in this section. It has weight, it flows, it piles up in some places and thins out in others, and it carries a variable amount of water around with it. Air is not nothing. A cubic meter of air at sea level has a mass of roughly 1.2 kilograms, which is about the same as a large pineapple. Stack the whole column of it above your head and the weight comes to about 101 kilopascals at sea level, or 1013 hectopascals in the units meteorologists actually write down. That is on the order of ten metric tons pressing on the top of an average adult, from every direction at once, which is why you never notice it.
Weather happens because that fluid is heated unevenly. The sun hits the tropics nearly head-on and the poles at a glancing angle, so the tropics absorb more energy per square meter. Land heats faster than water; a parking lot heats faster than a lawn. Warm air expands, becomes less dense, and rises; cooler denser air slides in underneath. Everything else follows from that: the winds, the clouds, the rain, the fronts marching across the map. The atmosphere is a very large machine for moving heat from where there’s too much of it to where there’s not enough, and it has never once caught up.
So when a forecaster says a low-pressure system is approaching, they are describing a place where the air column overhead weighs less than the columns around it. Air converges into that low from all sides, has nowhere to go but up, cools as it rises, and dumps whatever water it can no longer hold. The falling needle on that classroom barometer was measuring the front of that process, hours before the first cloud showed up.
What are the four ingredients that make weather happen?
Temperature, air pressure, humidity, and wind. Every weather event is these four interacting, and none of them moves independently of the others. If you learn nothing else from this article, learn the four couplings below, because they are the grammar of every forecast you will ever read.
- Temperature measures the average kinetic energy of the air molecules: how fast they’re jittering. Faster molecules spread out more, so warm air is less dense than cold air at the same pressure. That density difference is what makes air rise and sink.
- Air pressure is the weight of the air column above you, and it drops as you go up because there’s less atmosphere left overhead. It also drops when air warms and expands, or when air is being drawn upward and out of a region.
- Humidity is how much water vapor the air is carrying. Warm air can hold dramatically more of it than cold air, which is why the same amount of water vapor feels muggy in July and produces fog in October.
- Wind is air moving from higher pressure toward lower pressure. It is the atmosphere’s attempt to flatten out a pressure difference, and it never quite succeeds because the sun keeps making new ones.
Now the couplings. Heat the ground, and the air above it warms, expands, rises, and leaves slightly lower pressure behind: temperature drives pressure. Pressure differences drive wind: the steeper the pressure gradient across a distance, the harder the wind blows, which is why tightly packed isobars on a weather map mean grab your hat. Rising air expands as it moves into thinner surroundings, and expanding gas cools, so a rising parcel cools by roughly 10 °C per kilometer of ascent while it stays unsaturated. Cool that parcel enough and it hits the temperature where it can no longer hold its water vapor, the dew point, and the vapor condenses into droplets. That’s a cloud. Keep going and the droplets grow heavy enough to fall. That’s rain.
Four ingredients, one chain of consequences. Notice that the chain runs in both directions, too: condensation releases the latent heat that the water absorbed when it evaporated, which warms the surrounding air, which makes it rise faster, which pulls in more moist air. That feedback is why a thunderstorm can build so violently on a humid afternoon and why hurricanes need warm ocean water to survive. The ocean is the fuel tank, and the fuel is evaporated water.
How do we actually measure temperature and pressure?
Both instruments work by watching a material respond to the thing you want to measure, then reading the response off a scale. Four hundred years on, the method hasn’t changed a bit.
The thermometer
A liquid-in-glass thermometer relies on the fact that liquids expand more than glass when heated. Mercury and dyed alcohol both work; mercury reads more precisely over a wide range, alcohol keeps working far below the point where mercury freezes at about −39 °C, which matters if you are measuring winter in Manitoba. Mercury thermometers have been steadily retired from schools and weather stations over the past few decades because mercury is toxic and a broken one is a genuine cleanup problem, not a dustpan job. If you find an old mercury thermometer in a stockroom, that is a call to your facilities people, not a rag and a wastebasket.
Most official stations now use an electronic sensor instead, usually a thermistor or a platinum resistance thermometer. Both work on the same principle: the electrical resistance of the element changes predictably with temperature, so you measure resistance and convert. No liquid, no glass, and the reading can be logged automatically every few minutes, which is how modern observation networks produce continuous records instead of somebody walking outside twice a day with a clipboard.
The units are where students trip. Celsius and Fahrenheit are both scales with arbitrary zero points; kelvin has its zero at absolute zero, the point where molecular motion is at its minimum. Water freezes at 0 °C, 32 °F, and 273.15 K. A one-degree change in Celsius equals a one-kelvin change exactly, and equals 1.8 degrees Fahrenheit. Check your units before you convert anything, because a temperature difference and a temperature reading convert by different rules, and among the arithmetic errors I graded, this one topped the list every year.
Here’s the part nobody thinks about: where you put the thermometer matters more than which thermometer you buy. A sensor in direct sun reads the sun, not the air. That’s why official readings come from a white, louvered wooden box on legs called a Stevenson screen, standing about 1.25 to 2 meters above short grass. The white paint reflects sunlight, the louvers let air flow through while blocking radiant heat, and the standard height means a reading in Perth is comparable to a reading in Portland. Standardization is what makes any two measurements on Earth comparable at all. Change the height, the paint, or the ventilation and you have measured a different thing.
The barometer
Evangelista Torricelli built the first mercury barometer in 1643 by filling a glass tube with mercury, inverting it in a dish, and watching the column fall to a certain height and stop. What holds it up is the atmosphere pressing down on the mercury in the dish. Higher air pressure, taller column. At sea level the column settles at about 760 millimeters, which is where the old unit “millimeters of mercury” comes from, and why aviation and some American reports still quote pressure in inches of mercury at around 29.92 inches.
An aneroid barometer, the round dial kind you’ve seen on a wall, uses a sealed metal capsule with most of the air pumped out. Rising pressure squeezes the capsule slightly; falling pressure lets it spring back. A linkage amplifies that tiny flex into needle movement. No mercury, portable, and durable enough to strap to an aircraft, which is exactly what an altimeter is: a barometer with the dial relabeled in feet.
Meteorologists mostly work in hectopascals, and one hectopascal equals one millibar exactly, which is why you’ll see both terms used interchangeably by people who learned in different decades. Standard sea-level pressure is 1013.25 hPa. Readings get corrected to sea level before they go on a map, because otherwise Denver would look like it was under a permanent hurricane. If you want hectopascals, millibars and inches of mercury turned into each other in one place, that is what the closer look at barometer units is there for.
What matters for forecasting is the trend, not the number. Steady or rising pressure generally means settled weather. A fall of a few hectopascals over three hours means something is on its way, and the faster the fall, the more energetic it’s likely to be. That is a real forecast you can make from one instrument, standing in your own backyard.
How do we measure wind and humidity?
These two are harder, because wind has a direction as well as a speed, and humidity can be reported three different ways depending on what you need it for.
Wind
The standard instrument is a cup anemometer: three or four hemispherical cups on horizontal arms, spinning about a vertical shaft. The cups catch more drag on their concave side than their convex side, so the assembly turns in a steady direction no matter which way the wind comes from, and the rotation rate scales with wind speed. Count rotations, apply a calibration, get meters per second. A separate wind vane points into the wind and gives the direction, and by long convention wind direction names where the wind is coming from, so a “northerly” blows from the north toward the south. Nearly everyone gets it backwards the first time, so it is worth saying out loud when you read a map: a northerly comes from the north.
Modern stations often use sonic anemometers with no moving parts at all, timing ultrasonic pulses between fixed transducers. Wind moving with a pulse speeds it up, wind opposing it slows it down, and the timing difference gives both speed and direction on multiple axes at once. Nothing to wear out, nothing to seize in ice, and fast enough to catch turbulence a cup instrument would smear over. Cups or sound waves, the working parts of each get taken apart properly in the article on the anemometer.
Before any of these were widespread, Francis Beaufort’s scale let sailors report wind by its observable effects: what the sea surface looked like, how much sail a ship could safely carry. The Beaufort scale runs from 0 (calm, smoke rises vertically) to 12 (hurricane force), and it is still used, because a trained observer’s eye works when a sensor has iced over. Standard measurement height is 10 meters above open ground, since wind speed climbs sharply with height near the surface. Measure at 2 meters and you’ll underreport.
Humidity
Relative humidity is the number you hear on the news: the amount of water vapor in the air as a percentage of the maximum that air could hold at its current temperature. That last clause is doing enormous work. Because warm air holds more vapor, the same absolute amount of water can read as 40 percent at midday and 100 percent at dawn without a single molecule of water being added. Air at 100 percent relative humidity is saturated, and that’s when dew forms, fog develops, and clouds appear.
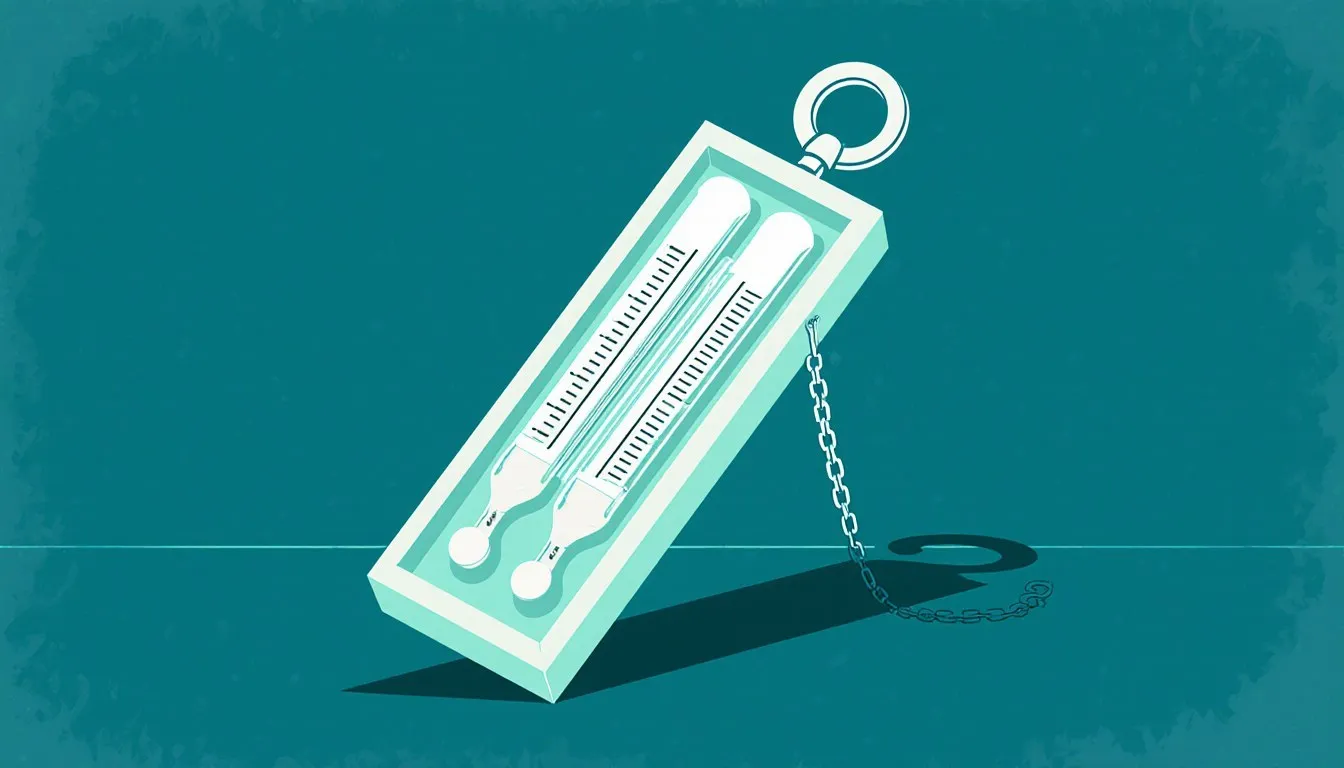
A sling psychrometer measures it with two thermometers and a sock. One thermometer is dry; the other has a wet muslin wick over its bulb. Whirl the pair through the air, and water evaporating from the wick draws heat away, so the wet bulb reads cooler. Dry air evaporates more water and cools the wet bulb further; saturated air evaporates almost nothing and the two thermometers read nearly the same. The gap between them, the wet-bulb depression, converts to relative humidity through a table. Whirl it too slowly and the wet bulb never reaches its lowest reading, which is one of the details in how a sling psychrometer works.
Mechanical hygrometers use materials that change dimensions with moisture, human hair being the historical favorite, since it lengthens by a small percentage as humidity rises. Electronic ones measure the changing capacitance of a moisture-absorbing polymer film between two electrodes, which is what sits in most automatic stations now. Students mix up relative humidity, absolute humidity and dew point every year without fail, so which one to trust for what is set out separately in the article on relative humidity.
Dew point is the one meteorologists prefer among themselves, because it doesn’t move when the temperature does. It’s the temperature to which air must be cooled to reach saturation. A dew point of 24 °C means genuinely oppressive air regardless of what the thermometer says, and when the overnight low is forecast to reach the dew point, expect fog.
How does water move through the atmosphere?
Water in the atmosphere is a heat-transport system disguised as weather. It runs in a loop: evaporation lifts water into the air, condensation drops it back out as cloud droplets, precipitation returns it to the surface, and runoff and groundwater carry it back to the ocean to start again. Roughly 86 percent of global evaporation comes off the oceans, and plants add their share through transpiration, which is why the combined term evapotranspiration shows up in hydrology.
The energy accounting is the part that makes it click. Evaporating one kilogram of water at ordinary outdoor temperatures takes about 2.45 megajoules, and about 2.26 megajoules if the water is already boiling, and every joule of it is stored in the vapor as latent heat. When that vapor condenses somewhere else, the energy comes back out and warms the surrounding air. A single ordinary thunderstorm cell can move a startling amount of energy this way. Do the arithmetic on a piece you can check: one millimeter of rain falling on one square kilometer is a thousand metric tons of water, a million kilograms, and each of those kilograms gave back about 2.45 megajoules when it condensed. That is roughly 2.45 trillion joules from one millimeter over one square kilometer, and a summer storm cell drops a good deal more than a millimeter over a good deal more than a square kilometer. The loop breaks into its stages, in order, in the steps of the water cycle.
What falls out of a cloud depends almost entirely on the temperature profile of the air it falls through. Water droplets that never freeze arrive as rain. Droplets that fall through a warm layer, melt, then refreeze in a cold layer near the ground arrive as ice pellets. Droplets carried up and down repeatedly inside a strong thunderstorm updraft accumulate layer after layer of ice and arrive as hail. People swap those two names constantly, and the difference between sleet and hail comes down to where in the column the freezing happened. A cross-section through the atmosphere with three temperature layers explains the whole menu, which is a nice reminder that a vertical profile tells you things a surface reading never will.
The instrument that closes the loop is the rain gauge, and it is the simplest tool in the whole kit: a container that catches falling water and a way to measure the depth collected. A standard gauge uses a funnel feeding a narrow inner tube, so the collected water stands deeper and can be read to a finer resolution. Tipping-bucket gauges use a small see-saw that dumps and sends an electrical pulse each time a fixed volume collects, which gives rate as well as total. Precipitation is reported as a depth, typically millimeters or inches, because depth is independent of the collector’s area: 10 millimeters means every square meter of ground received 10 liters. Siting matters as much as it does for thermometers, since a gauge under a tree or beside a wall measures the tree or the wall. Each design has its own way of underreading in strong wind, worth knowing before you trust a total, and the article on rain gauges goes through them.
And when sunlight meets the water still suspended in the air after a shower, you get the optical bonus round: light refracting into a spectrum inside each droplet, reflecting off the back, and refracting again on the way out. The bow always sits at the same angle from the point directly opposite the sun, and the geometry that fixes it there is drawn out in how do rainbows form. For the odd ones, doubles, fogbows, moonbows, see types of rainbows.
Why does weather change from one place to the next?
Because the ground underneath the atmosphere is not uniform, and every irregularity in it rearranges the four ingredients locally. Drive an hour in most parts of the world and you cross into different weather, because you have changed the surface the atmosphere is working against: its slope, its colour, its wetness, its roughness.
Mountains are the most dramatic case. Air forced up a windward slope expands and cools, its water vapor condenses, and it rains on that side. The same air, having lost its moisture, descends the far slope, compresses, and warms, arriving dry. That’s why one side of a range is temperate rainforest and the other side is sagebrush, sometimes within 50 kilometers. Meteorologists call that forced lifting the orographic effect, and the rain shadows it leaves downwind get an article of their own.
Temperature usually falls with height in the lower atmosphere, but not always. When a layer of warm air sits on top of cooler air near the ground, the normal arrangement is inverted, and the cool air is trapped underneath because it has no buoyancy to rise through the warm lid. Fog settles in valleys. Pollution accumulates. Sound carries strangely far, because the temperature boundary bends sound waves back toward the ground. Anyone who has lived in a valley town in winter knows the feeling of a week when the air simply refuses to move; that lid is the reason, and the causes and effects of a temperature inversion, including the winter smog episodes they trap, get a longer look separately.
Coastlines generate their own daily weather from a straightforward difference in heat capacity. Water takes about four times as much energy per kilogram to warm by a degree as most rock and soil, and it mixes that heat downward through a deep layer instead of concentrating it at the surface. So land warms faster by day and cools faster by night. By afternoon the air over the land has risen, the pressure there is slightly lower, and cooler air flows in off the water: the sea breeze. After sunset the land cools below the water temperature and the circulation reverses into a land breeze. This is why the coast is reliably cooler than 20 kilometers inland on a hot afternoon, and it’s a circulation you can predict on your own calendar.
Cities do the opposite. Asphalt and masonry absorb solar energy all day and release it slowly at night, while the absence of vegetation removes the evaporative cooling a landscape would otherwise provide. The result is an urban heat island, where a city center can hold onto several degrees more warmth overnight than the countryside around it. Two thermometers, one downtown and one in a field, will show you the effect on any clear calm night.
How do meteorologists turn measurements into a forecast?
By collecting standardized readings from thousands of stations at agreed times, plotting them on one map, and running the resulting picture forward through physics equations. Each step depends on the previous one, and the standardization step is the one that gets undersold.
A reading is only useful if it’s comparable. That’s what the World Meteorological Organization exists to enforce: agreed units, agreed instrument exposure, agreed observation times, and agreed reporting formats, so an observation from a station in Chile means the same thing as one from a station in Norway. Standard synoptic observation times are referenced to Coordinated Universal Time rather than local clocks, precisely so nobody has to work out what “9 a.m.” meant in a particular time zone during a particular week of the year.
Those readings get plotted as a station model: a small cluster of numbers and symbols around a circle at each station’s location on the map. The circle’s shading gives cloud cover, a barbed line gives wind direction and speed with each full barb worth ten knots, and the numbers flanking it give temperature, dew point, pressure, and the pressure trend over the past three hours. It is dense, and it is not decorative. A trained forecaster reads more from one station model than a paragraph of prose would carry, because the whole point is fitting fifty stations on one sheet and seeing the pattern between them. Learning the marks takes an afternoon and repays it for years; they are catalogued in the list of all weather symbols with their meanings.
Connect the points of equal pressure and you get isobars; where they crowd together, the pressure gradient is steep and the wind is strong. Where warm and cold air masses meet, you get a front, drawn with triangles on a cold front and semicircles on a warm front, pointing in the direction the boundary is moving. A cold front shoves under warmer air and lifts it abruptly, which is why cold fronts bring narrow bands of intense weather and a sharp temperature drop behind them. A warm front slides up over cooler air at a shallower angle, giving hours of gradually thickening cloud and steady rain.
The modern forecast, though, is arithmetic. Numerical weather prediction divides the atmosphere into a three-dimensional grid, loads each cell with the observed values, and steps the equations of fluid motion and thermodynamics forward in small time increments. The observation network, including balloon-borne radiosondes that transmit readings as they ascend, plus radar, plus satellites, supplies the starting conditions. Forecasts degrade past about a week because the atmosphere is chaotic: a rounding error in one grid cell’s starting temperature doubles, then doubles again, until by day ten it has swallowed the whole solution. That’s why forecasters run ensembles, dozens of slightly perturbed versions of the same model, and report the spread as a probability. A 30 percent chance of rain is a count: roughly three runs in ten put rain on your location.
None of it works without the boring part. Every model on Earth is downstream of somebody’s correctly sited thermometer in a white wooden box.
Is weathering the same thing as weather?
No, and the shared root causes more confusion than almost any other pair of terms in earth science. Weather is the atmosphere’s condition over minutes to days. Weathering is the breakdown of rock at or near the surface over years to millennia, driven in large part by what the weather has been doing all that time. One is a state; the other is a slow process the state produces.
The link between them is direct. Water seeps into a crack in granite, freezes overnight, and expands by about nine percent as it forms ice, wedging the crack wider. Thaw, refill, refreeze, repeat for a few thousand winters and the boulder splits. That’s frost wedging, and it requires exactly the freeze-thaw cycling that a temperature record documents. The same goes for thermal expansion cracking in deserts, where a large daily temperature swing stresses rock surfaces, and for abrasion by wind-carried sand, which is just wind measurement applied over geologic time.
Those physical breakdown processes are grouped as mechanical weathering, and taking the drivers one at a time is the job of what causes mechanical weathering, with the same processes photographed out in the field in real life examples of weathering. There is also chemical weathering, where water and dissolved carbon dioxide react with minerals rather than simply cracking them, which is how limestone caves form and how feldspar becomes clay.
Saying the distinction out loud forces you to attach a timescale to a process, which is a habit worth having everywhere in earth science. Weather is measured with instruments in the field today. Weathering is measured by looking at what those conditions have accomplished over a span nobody in the room will live to see.
How does the clock fit into weather watching?
Because a measurement without a timestamp is nearly useless, and timestamps are harder than they look. A temperature of 22 °C tells you very little on its own. The same 22 °C at 5 a.m. in December and at 3 p.m. in July are two entirely different pieces of information about the atmosphere.
Weather runs on two nested cycles, both astronomical. Earth’s rotation gives the daily cycle: ground heats through the morning, air temperature typically peaks a couple of hours after solar noon because the surface takes time to pass its heat upward, and cooling continues through the night to a minimum near dawn. Any six-year-old asks why the light goes away and comes back, and what causes day night answers it properly. Earth’s axial tilt gives the annual cycle, changing the angle at which sunlight strikes each hemisphere, which drives the seasons and every seasonal weather pattern layered on top.
Which is why observation networks report in Coordinated Universal Time and largely ignore local clock conventions. Local time is a political construction laid over an astronomical fact, and it shifts: clocks jump forward and back on dates that vary by country and change by legislation, which is exactly the sort of thing that corrupts a long temperature record if you’re careless. Picture a volunteer observer who has read the gauge at 8 a.m. by the kitchen clock since 1974. Every spring, the morning the clocks go forward, that reading silently becomes a 7 a.m. reading in solar terms, taken nearer the dawn minimum, and it stays shifted for seven months. Nobody notices, because the numbers still look like temperatures. Decades later the record shows a spurious cooling every spring and a warming every autumn, all of it manufactured by the clock rather than the air. That is why the observation rules pin the hour to a fixed standard and why anyone comparing old station records has to know which schedule of daylight saving time the country was on in a given year. The calendar has its own irregularity too, since the year isn’t a whole number of days and we patch the difference with an extra day at intervals that follow a rule with exceptions, and those exceptions are far easier to see laid out than described, which is what the full list of leap years does century by century.
For anyone keeping their own records, that translates into one habit: take your readings at the same time each day, note the time, and note the time standard you’re using. Timing drift is the flaw you cannot repair later, because nothing in the numbers themselves tells you which readings were taken early.
Reading the four numbers together
Put the four readings side by side and each one tells you what to expect next. Temperature climbing faster than usual through the morning means the afternoon air can hold more vapor and hand more energy to any storm that gets going. A barometer three hectopascals lower than it stood at breakfast means air is rising somewhere upwind, and cloud usually arrives before the needle comes back. A dew point within two or three degrees of tonight’s forecast low means fog or heavy dew by dawn, whatever the daytime humidity did. A wind that swings direction sharply and freshens at the same time has generally just had a front go over it, so expect the temperature to move within the hour. One reading is a snapshot; the four read together are a short forecast, and every one of them can be checked against tomorrow morning.
None of these instruments is exotic. A thermometer in a shaded, ventilated spot away from walls, an aneroid barometer on an interior wall, and a straight-sided container in an open patch of yard will give you three of the four with reasonable honesty, provided you site them properly and read them at the same time each day. The wind is the hard one to do well at home, since anything within about ten times its own height of your sensor is disturbing the flow you’re trying to measure.
Try this: take the barometer reading at the same hour for a fortnight, note the weather the following morning beside it, and see how many of the falls you can match to a change in conditions. Two weeks of your own data will teach you more about pressure than any explanation of it, mine included. The falls you can’t match are as informative as the ones you can: they are usually the shallow slow ones, and learning to ignore those is half of reading a barometer.
Nora Whitfield
Staff Writer
Nora Whitfield taught high-school chemistry and physics for twenty-eight years, and she has never once answered "when will I use this?" with a sigh. She believes any honest question about how the world works deserves an answer that is both correct and actually understandable.