

The Layers of the Atmosphere Begin Where the Temperature Turns Around
The five layers of the atmosphere are set by temperature reversals rather than fixed heights. Here’s what marks each boundary, from tropopause to exosphere.
A jet cruising at about 11 kilometers (roughly 36,000 feet) is usually flying above the weather, and that is no accident. It has climbed out of the only layer where weather can physically happen. Higher still, the International Space Station orbits near 400 kilometers, and it is technically flying too: there is enough gas up there to drag on it, so it needs a periodic push to keep from spiraling down.
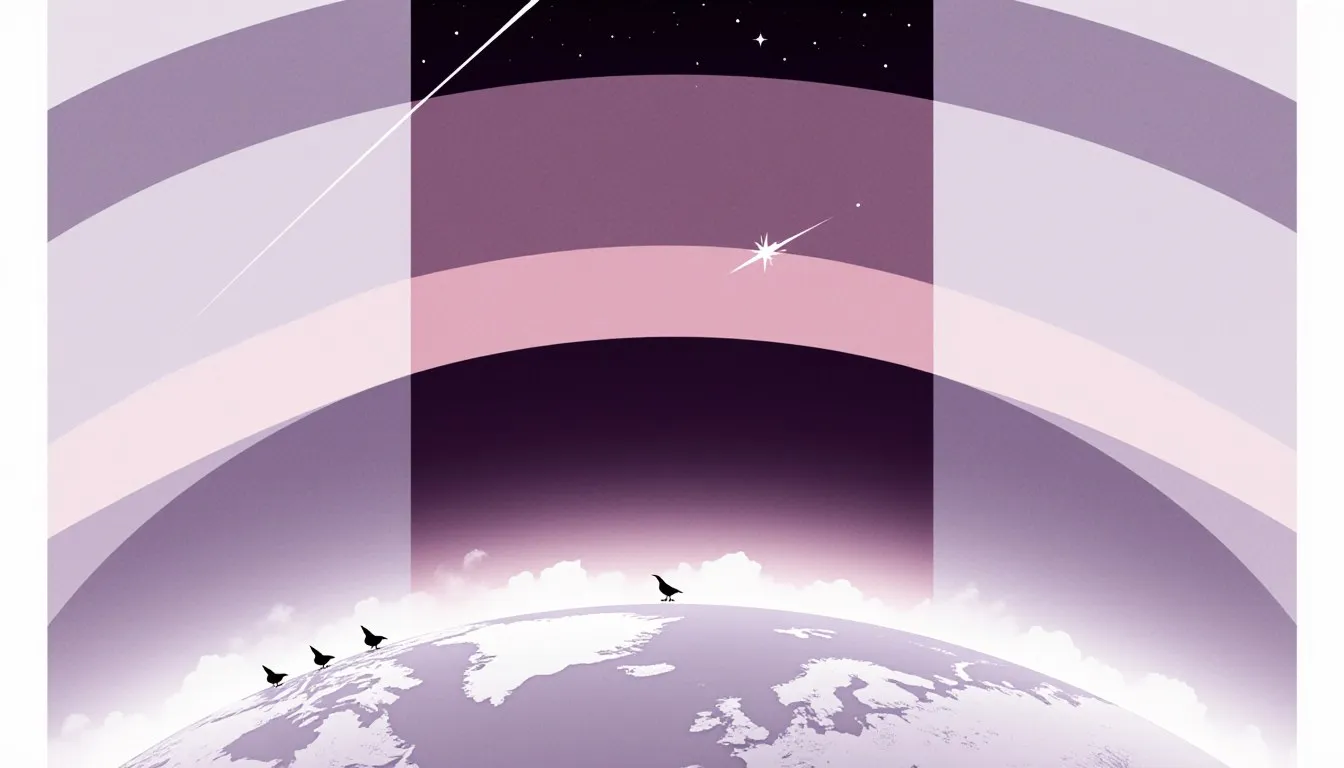
The atmosphere has five layers, and each boundary between them sits where the temperature stops doing one thing and starts doing the opposite. Air cools as you climb through the troposphere, warms through the stratosphere, cools again through the mesosphere, then rises steeply in temperature through the thermosphere before fading into the exosphere and, with no ceremony at all, into space. Four turning points, five layers, and every one of those turns has a name and a reason. Once you can picture that zigzag graph, the ozone layer, the aurora, and the edge of space all fall into place as landmarks along one line.
What Are the Layers of the Atmosphere?
The five layers, bottom to top, are the troposphere, stratosphere, mesosphere, thermosphere, and exosphere. Together they hold roughly five quadrillion tonnes of gas, and gravity keeps almost all of it pressed into a shell so thin that if Earth were a classroom globe, the breathable part would be thinner than the varnish.
That thinness is worth sitting with. Half the entire mass of the atmosphere lies below about 5.5 kilometers, which is lower than the summit of Kilimanjaro. Everest, at 8,849 meters, pokes into air holding roughly a third of sea-level pressure. Nearly everything you would call sky, all the clouds, all the storms, essentially all the water vapor, occupies a band you could drive through in ten minutes if the road went straight up.
Older textbooks sometimes list the ionosphere as a sixth layer, and the article you may have read in school probably did. That is a category error I spent years untangling for students. The ionosphere is real, but it is defined by electrical charge rather than temperature, and it straddles the upper mesosphere and thermosphere rather than sitting above them. Mixing it into the list is like listing “the wet part” alongside the floors of a building.
How Many Layers Does the Atmosphere Have, and What Actually Separates Them?
Five, and the separations are temperature reversals rather than fixed heights. Here is the belief worth correcting first, because almost everyone carries it: air keeps getting colder the higher you go. Every bit of everyday evidence supports it. Mountaintops hold snow in July. The cabin display on a long flight reads something brutal like -55 °C (-67 °F) outside. Both observations are honest, and both come from inside the troposphere, which is the only layer any of us has personally experienced.
Go higher and the graph zigzags. The reason is simple once you ask where the heat is coming from in each layer, and this single question organizes the whole structure:
- Troposphere: surface to about 8 km over the poles and 16 to 18 km over the equator. Heated from below, because the ground absorbs sunlight and re-radiates it as infrared. Farther from the stove, colder air. Temperature falls with height.
- Stratosphere: tropopause to about 50 km. Heated from within, by ozone soaking up ultraviolet light. Temperature rises with height.
- Mesosphere: about 50 to 85 km. Above the ozone, with carbon dioxide radiating heat away to space very efficiently. Temperature falls with height, to the coldest readings anywhere on Earth.
- Thermosphere: about 85 km to somewhere between 500 and 1,000 km. Heated from above, where extreme ultraviolet and X-rays from the Sun tear apart the first molecules they meet. Temperature climbs steeply, then flattens.
- Exosphere: from the top of the thermosphere outward, thinning until the word “atmosphere” quietly stops applying.
The turning points are the tropopause, stratopause, mesopause, and thermopause. Each is defined the same way: the altitude where the sign of the temperature trend flips. That is why the numbers above come with “about” attached. The tropopause sits near 17 km over the tropics and can drop below 8 km over a winter pole, and it shifts with the seasons and with individual weather systems. Defining a layer by a number would mean redrawing the map daily. Defining it by the shape of the graph works everywhere.
If you want each layer’s features laid out one at a time, we walk the atmosphere layers in order in a separate piece, at a slower pace than an overview allows. What follows here is the temperature story, layer by layer.
What Is the Troposphere?
The troposphere is the layer you live in, breathe, and complain about, and it contains roughly 75 to 80 percent of the atmosphere’s mass along with about 99 percent of its water vapor. Its name comes from the Greek tropos, meaning turning, which is exactly right: this is the layer that overturns. Warm air near the surface is less dense than the cooler air above it, so it rises, cools, and lets its water vapor condense into cloud. That overturning is weather.
Temperature falls with height here at an average of about 6.5 °C per kilometer, which pilots and meteorologists in the United States more often quote as roughly 3.6 °F per 1,000 feet. Those are the same rate wearing different clothes, and confirming that for yourself takes thirty seconds of arithmetic. Check your units before you trust either number in a calculation.
“Average” is doing real work in that sentence. The actual lapse rate on any given day is whatever the atmosphere feels like, and it is measured directly rather than assumed. NOAA’s forecasters release weather balloons twice a day from sites across the country, and each one radios back temperature, humidity, and pressure as it climbs, until it expands and bursts somewhere above 30 kilometers. Those profiles are the raw material of forecasting. When the measured lapse rate is steep, rising air stays warmer than its surroundings and keeps going, which is a recipe for thunderstorms. When a layer of warm air sits on top of cooler air, an inversion, the rising stops and pollution stalls underneath it. Anyone who has watched smog settle into a valley on a still winter morning has watched an inversion hold a lid on.
Two things share this layer that people rarely picture together: nearly all clouds, and nearly all commercial aviation. Cruising altitude for an airliner is chosen to sit just above most of the turbulence and weather, which at mid-latitudes usually means clipping the bottom of the stratosphere, while over the tropics that same altitude is still comfortably inside a much deeper troposphere. The tropopause itself sits roughly twice as high over the equator as it does over a winter pole, so the same cruising altitude lands in a different layer depending on latitude.
By the time you reach the tropopause, temperatures run near -60 °C (about -76 °F), and over the tropics can approach -80 °C (-112 °F). That is the coldest air in the layer, and it is also the ceiling. Above it, the trend reverses.
What Is the Stratosphere, and Why Does It Warm Up?
The stratosphere warms with altitude because ozone absorbs ultraviolet light and converts it to heat right there in the layer. Ozone (O3) forms when UV splits an oxygen molecule and the loose atoms latch onto other O2 molecules. That same UV then breaks the ozone apart again, and the cycle runs continuously, shedding energy as heat with each pass. The gas absorbs the ultraviolet wavelengths most damaging to living tissue, which makes this layer a sunscreen that heats itself up in the process of working.
The scale of the thing tends to surprise people. The “ozone layer,” spread through roughly 15 to 35 kilometers, is never more than a few parts per million of the air around it. Collect the entire ozone column above your head and compress it to sea-level pressure, and it would form a shell about three millimeters thick. Three millimeters, doing that job. When I first worked that number out for a class, one student refused to believe I had not dropped a factor of ten. I hadn’t, and the calculation is worth doing yourself.
Because temperature increases with height here, the stratosphere is one enormous inversion. Warm air sitting on cold air has no reason to overturn, so vertical mixing nearly stops and the layer settles into smooth, stable, horizontal flow. That stability is why the layer is named for stratus, spreading out, and why it is such good flying. It is also why anything that reaches the stratosphere stays a long time. Volcanic sulfate from a large eruption can circle the globe up there for a year or two, dimming sunlight measurably. Chlorofluorocarbons had a similar patience, drifting up over decades before their chlorine started dismantling polar ozone, which is what the Montreal Protocol was written in 1987 to stop.
Clouds are scarce here because the air is desperately dry, most water having condensed out long before. The exception is spectacular. During polar winter, at temperatures below about -78 °C (-108 °F), polar stratospheric clouds form and glow in iridescent mother-of-pearl colors after sunset. They are also chemically important, because their surfaces let chlorine compounds convert into forms that attack ozone once spring sunlight returns.
Human beings have been up here, briefly and with enormous engineering behind them. In 2012 a skydiver stepped out of a balloon capsule at about 39 kilometers and fell back through the stratosphere. Above roughly 19 kilometers, the Armstrong limit, ambient pressure is low enough that water boils at body temperature, so a pressure suit is what keeps a person’s blood from boiling. The stratosphere is beautiful and it is not survivable.
At the stratopause near 50 kilometers, temperatures peak close to 0 °C (32 °F), the freezing point of water. That warm ceiling is the second turning point, and past it the graph heads back down.
What Is the Mesosphere?
The mesosphere is the coldest layer of the atmosphere, bottoming out near -90 °C (-130 °F) at the mesopause around 85 kilometers, and it is where most meteors burn up. Its name means middle, which is the least interesting fact about it.
The cold has a clean explanation. There is little ozone left up here to catch ultraviolet, so the layer has almost no local heat source, while the carbon dioxide it does contain is very good at radiating infrared energy straight out to space. Heat leaks out faster than sunlight puts it in, and the temperature drops with every kilometer of climb.
Then the mesosphere does something genuinely counterintuitive. The coldest spot on the planet is the summer polar mesopause, not the winter one. Rising motion driven by the global circulation of this layer expands and cools the air over the summer pole so hard that it can approach -100 °C (-148 °F), colder than anything the winter pole manages. That is the setup for noctilucent clouds, wisps of ice forming near 80 kilometers, so high that they still catch sunlight an hour or more after the ground has gone dark. They are the highest clouds on Earth, they are electric blue, and they are visible from mid-latitudes on summer nights if you look toward the northern horizon well after sunset. First reported in the 1880s, they appear to have grown more frequent since, which has kept a good many atmospheric scientists interested.
Meteors make their entrance in this layer. Almost everyone learns that meteors burn up from friction, and the heat actually comes from compression. A grain of dust or sand striking the atmosphere at tens of kilometers per second cannot shove the air out of its way fast enough, so it piles that air into a thin shock layer hot enough to glow, and the glowing air strips the grain apart, mostly between roughly 75 and 100 kilometers. A shooting star is a sand grain being taken apart by air you would call a vacuum in any laboratory on the ground.
The mesosphere also holds a thin layer of neutral sodium atoms near 90 kilometers, delivered by all that vaporized meteoric material. Astronomers make deliberate use of it: large telescopes fire a laser tuned to sodium’s yellow line into the sky, the layer glows back, and the artificial star they have just created lets the telescope’s optics measure and cancel out atmospheric blurring. A shovelful of vaporized meteor dust, doing optics.
Almost nothing flies here. The air is far too thin for wings and far too thick for orbits, which is why this band was studied for decades mainly by sounding rockets punching through it for a few minutes at a time. It remains the least directly sampled part of the atmosphere.
What Is the Thermosphere?
In the thermosphere, temperature climbs steeply again, past 500 °C (about 930 °F) and, when the Sun is active, well beyond 1,500 °C (about 2,700 °F). A thermometer floating up there would nonetheless read bitterly cold, and both statements are true at once.
Temperature measures the average kinetic energy of individual particles, meaning how fast the molecules are moving. The individual particles in the thermosphere are moving extremely fast, because the first solar photons to arrive from space are the highest-energy ones, extreme ultraviolet and X-rays, and they slam into whatever they hit. But the gas is so sparse that a given molecule may travel a kilometer before meeting another one. Heat transfer needs contact, and there is almost none to be had. Think of a sparkler: the sparks are white-hot by any measurement, and they land on your hand without harm because each one carries an almost nothing amount of energy. The analogy gets you most of the way, and it breaks down in one place worth knowing: a sparkler spark cools off in flight, while a thermosphere molecule stays hot, and an object up there loses heat by radiating it away faster than collisions can deliver it. That is why spacecraft thermal control is mostly a problem of managing radiation, not air.
This is aurora country. The solar wind carries charged particles past Earth, the planet’s magnetic field funnels some of them down toward the poles, and they collide with oxygen and nitrogen typically between 100 and 300 kilometers up. The collisions kick electrons into higher energy states, and when those electrons drop back, they release the extra energy as light at wavelengths specific to each gas. Atomic oxygen produces the familiar green at 557.7 nanometers and a deep red from higher altitudes; nitrogen contributes blues and purples along the lower edges. Aurora borealis in the north, aurora australis in the south, and they usually appear as a matched pair, because the same magnetic field lines thread both hemispheres.
The overlapping ionosphere lives largely in this range too, the region where solar radiation strips electrons from atoms and leaves a soup of charged particles. It is layered by which wavelengths get absorbed where: a D region below about 90 km, an E region above that, and an F region reaching several hundred kilometers. Those charged layers reflect radio waves back down, which is why a shortwave signal can reach the far side of the world by bouncing. It is also why distant AM stations come in clearly at night and vanish by morning: the D region, which absorbs those frequencies during the day, largely dissolves after dark and lets the signal reach the reflective layers above.
Nearly everything in low Earth orbit flies through the thermosphere, including the ISS at around 400 kilometers, and every one of those objects feels drag. The layer also breathes. When solar activity rises, the thermosphere heats and puffs outward, raising the density at any given altitude and increasing drag on everything passing through. In early 2022 a geomagnetic storm expanded it enough that dozens of newly launched Starlink satellites, still in their low insertion orbits, could not climb out and reentered. Space weather forecasting is, in large part, forecasting this layer’s mood.
What Is the Exosphere, and Where Does the Atmosphere Actually End?
The exosphere is the outermost layer, beginning somewhere between 500 and 1,000 kilometers, and the honest answer to where the atmosphere ends is that the gas keeps thinning for thousands of kilometers past that, dropping by orders of magnitude with every few hundred, until the last stray hydrogen atoms belong as much to interplanetary space as to Earth. Somewhere in that fade, collisions between particles become too rare to matter, and that is the closest thing to a boundary the physics offers.
The bottom of the exosphere is the exobase, and it is defined by a lovely physical criterion: it is the altitude above which a particle is more likely to fly all the way out and back on a curved ballistic path than to bump into anything. Below it, gas behaves as a fluid, with collisions and pressure and mixing. Above it, individual atoms follow trajectories like tiny thrown balls, and gravity alone decides whether each one arcs back down or keeps going.
What is left up there is mostly hydrogen and helium, the two lightest gases, which is exactly what you would predict. Earth loses some of them permanently, on the order of a few kilograms of hydrogen every second, escaping to space. Over the planet’s lifetime that adds up, and it is a large part of why Earth’s chemistry drifted the way it did. Enough hydrogen remains in transit to scatter ultraviolet sunlight into a faint glow called the geocorona, and spacecraft measurements of that scattered light have traced it far beyond the Moon’s orbit. By that measure, the Moon travels inside Earth’s outermost atmosphere, which is true and also nearly meaningless for anyone building a spacecraft.
Which brings up the Kármán line. The conventional edge of space sits at 100 kilometers, named for the aerodynamicist Theodore von Kármán, who reasoned that at some altitude the air becomes so thin that a vehicle would have to travel faster than orbital speed to generate enough lift to hold itself up, at which point it may as well be in orbit and aerodynamics stops being the relevant subject. The FAI adopted 100 km, a round number in a round unit, and the neatness is part of why it stuck. United States agencies have long awarded astronaut status at 50 miles, about 80 kilometers, which is a different round number in a different unit and reflects a defensible reading of the same physics.
Both are conventions drawn across a gradient. Any legal line has to sit somewhere on a physical slope, and 100 kilometers and 50 miles are two defensible places to put it, chosen by different bodies for different purposes. Space begins where we agreed it does, and the atmosphere keeps thinning right through the agreement without noticing.
What Is the Atmosphere Made Of?
Dry air at sea level is 78.08 percent nitrogen and 20.95 percent oxygen by volume, with argon at 0.93 percent and carbon dioxide a bit over 0.04 percent and climbing. Water vapor sits outside that accounting because it varies so much, from nearly zero over a polar desert to around four percent in humid tropical air, and it is the most important trace gas in the whole system.
The striking thing is how far up those proportions hold. From the ground to roughly 100 kilometers, turbulence stirs the air faster than gravity can sort it, so the mixture stays essentially uniform. That entire region is called the homosphere, and it means the nitrogen-to-oxygen ratio in the mesosphere is about the same as the ratio in the room you are sitting in, even though the density there is a millionth of what you are breathing.
Above about 100 kilometers, at the turbopause, mixing loses to gravity and the gases begin to settle out by molecular mass. That upper region, the heterosphere, layers itself: atomic oxygen dominating first, then helium, then hydrogen at the top. This is why the composition of the exosphere reads so differently from the composition at your kitchen window. The atmosphere sorts itself only once the wind stops stirring the pot.
Each of those gases has a story about where it came from and what keeps it in balance, and the fuller account of the composition of the atmosphere is the place to follow that. Nitrogen repays the most attention here. A gas that unreactive holding four-fifths of the air is not obvious, and the question of how nitrogen in the atmosphere got there and stays there runs through volcanic outgassing, lightning, and the bacteria that pull it back down into the soil.
One number in that list is not holding steady, and it is the small one. Carbon dioxide is a trace gas that absorbs infrared radiation on its way out of the troposphere, and the concentration has been rising measurably since continuous instrument records began at Mauna Loa in 1958. Small percentages do heavy lifting when the mechanism is right. Three millimeters of ozone shields a planet, and a few hundredths of a percent of CO2 sets a good deal of its surface temperature.
How Do These Layers Shape Weather and Climate?
Weather happens in the troposphere and nowhere else, for the structural reason described earlier: it is the only layer heated from below, and therefore the only layer that overturns. Give a fluid a warm bottom and a cold top and it will convect. Give it a cold bottom and a warm top, as the stratosphere has, and it will sit there.
You can watch the boundary enforce itself. A large thunderstorm builds upward through the troposphere until it hits the tropopause, where the rising air finds itself suddenly cooler than the warm stratospheric air above and can climb no further. So it spreads sideways into the flat anvil shape you can see from fifty kilometers away. That anvil is the tropopause made visible. Occasionally a violently strong updraft punches a dome a kilometer or two above the anvil, an overshooting top, and forecasters treat it as a warning sign, because a storm strong enough to break through that ceiling is strong enough to do damage underneath.
Uneven heating starts everything. The tropics receive sunlight nearly head-on and the poles receive it at a glancing angle, so the atmosphere is permanently trying to move surplus heat poleward and never finishes. That imbalance drives the great circulation cells and the belts of prevailing wind riding on them, and the persistent surface patterns that follow, the global winds, get a fuller treatment of their own, as does the belt of prevailing westerlies that steers most storms across North America and Europe. The band where the heating is most direct year-round gets its own treatment under the torrid zone.
Where air masses of different temperature and humidity meet, you get fronts, and their behavior is the daily bread of forecasting. A cold front overtaking a warm one lifts the warm air clear off the ground, a process laid out with diagrams in the explanation of occluded front with diagram. When neither air mass can displace the other, you get a stationary front, the boundary parks, and rain repeats over the same counties for days, which is a standoff much easier to follow with a labeled diagram in front of you. All of it happens inside that thin bottom layer.
The layers above are not sealed off, though, and this is where the graph turns into a system rather than a stack. The stratosphere can reach down and change your week. Each winter a circumpolar current of cold air, the polar vortex, spins over the Arctic stratosphere. Sometimes it is disrupted and the stratosphere warms dramatically in a matter of days, an event called a sudden stratospheric warming. In the weeks afterward, the disruption can propagate downward and shove the jet stream far to the south, delivering the kind of cold outbreak that closes schools in Texas. Meanwhile the ozone layer’s absorption sets the stratosphere’s temperature structure, which sets how firmly the tropopause caps convection below, and carbon dioxide warms the troposphere while cooling the stratosphere, a fingerprint of greenhouse warming that is difficult to explain any other way.
So the list above is a map of altitudes, and the zigzag it describes is a map of energy: where sunlight is absorbed, where heat escapes, and which direction the temperature runs in between. The next clear evening after a thunderstorm, find the anvil and look at how sharply flat its top is. You are looking at the exact height where the graph turns around, drawn by the storm itself.
Nora Whitfield
Staff Writer
Nora Whitfield taught high-school chemistry and physics for twenty-eight years, and she has never once answered "when will I use this?" with a sigh. She believes any honest question about how the world works deserves an answer that is both correct and actually understandable.