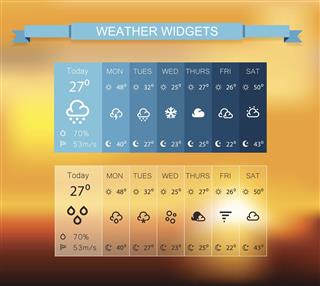
The different symbols on your smartphone’s weather app have specific meanings. You must be updated with all the information about the various types of weather signs, along with their meanings and illustrations.
Fast Fact
The oldest weather report ever found is in the form of a calcite block tablet called Tempest Stella. This tablet is complete with weather symbols used during those times, and is dated to be around 3,500 years old, probably belonging to the 18th Dynasty pharaoh called Ahmose I.
Weather maps have been used since ancient times to represent various phases, types, and the ever-changing characteristics of climate in different parts of our planet. The signs that are used for such representations in these maps are called weather symbols. Although there exists a universal list of such symbols, many variants have now been developed that are compatible for viewing in modern devices.
Considered as a class of important tools used by meteorologists, weather maps and associated symbols were manually drawn in the past. The same type of graphical map representations are now digitally made, using real-time data. In the field of meteorology, readings and values of various atmospheric parameters are taken at specific intervals around the globe at weather stations. These values are then processed and interpreted by meteorologists using latest software programs, and conclusions are drawn using this data to prepare weather maps. The type and number of symbols are decided depending on the kind of weather of the region where the readings are taken. The following image illustrates the main symbols which are used in describing the weather of a particular region.
Considered as a class of important tools used by meteorologists, weather maps and associated symbols were manually drawn in the past. The same type of graphical map representations are now digitally made, using real-time data. In the field of meteorology, readings and values of various atmospheric parameters are taken at specific intervals around the globe at weather stations. These values are then processed and interpreted by meteorologists using latest software programs, and conclusions are drawn using this data to prepare weather maps. The type and number of symbols are decided depending on the kind of weather of the region where the readings are taken. The following image illustrates the main symbols which are used in describing the weather of a particular region.
The list of measured values and their respective symbols include precipitation, cloud cover and types, wind speed, wind direction, front line boundaries (cold, hot, and occluded), sky clarity, etc. All these signs have been explained below with the help of illustrations.
What Do Different Weather Icons Mean?
There are several basic symbols which tell you about the changing weather, especially if a storm is approaching. Nowadays, most people refer to modern devices like smartphones, tablets, and other gadgets for such information. On these devices, the letter ‘R’ with an arrow pointing in the downward direction means that a storm is predicted. The blue and green colors indicate flooding, and white signifies that a snow storm might occur. These signs are also shown on weather reports on TV.
Cloud Cover and Types
Clouds are differentiated into various categories, depending on their appearance and the altitude at which they are present. Cloud cover refers to the percentage of portions of the sky which is blanketed by clouds, further affecting the local weather. Go through the following representations to better understand these terminologies. Cumulus clouds are drawn as semicircles, whereas cumulonimbus are in the form of a semicircle with a trapezium on top. Altocumulus is drawn as two semicircles joined to each other. All the cirrus clouds are drawn as lines with curves, and altostratus is in the form of an acute angle. Thus, the clouds in a symbolic form appear more or less as they are present in the atmosphere.
Cloud cover is shown in the manner of a circle that can be divided into equal parts. Few of these portions are colored, depending on the percentage of the cloud cover. A completely covered sky is drawn as a clack circle, while specifically darkened quadrants indicate the sky cover in the form of fractions, like two-tenths, five-tenths, six-tenths, etc. No clouds means a completely colorless or white circle. Sometimes, both the sky cover and cloud type symbols are written together to provide more data from the studied regions.
Weather Fronts
These are also called front line boundaries, and they represent the line of separation between hot and cold air masses which are present in either high or low pressure areas. A high pressure area is denoted by ‘H’ in blue, whereas, a low pressure area is denoted by ‘L’ in red. The former is characterized by atmospheric air under increasing pressure which sinks towards the land surface. The latter is characterized by decreasing pressure of air which is lifted upwards.
A cold front is represented by a blue-colored curved line with triangular points, which indicate the direction of the wind currents. The warm fronts are represented by curved red-colored lines with rounded/semi-circular points, which are oriented towards the wind current direction.
When both the lines meet at particular areas, they form a stationary front; these are boundaries that do not show much movements, and are represented by alternating points of both front types. They can move in a forward and backward direction every day, with all the points showing more or less similar intensity. When a cold front overcomes a hot one, it is represented by a purple line, with both rounded and triangular points oriented in the same direction. This usually tells us about the approach of a storm.
Precipitation
Such signs can be easily viewed on many modern gadgets. Two dots placed close to each other indicate average rainfall, while four dots indicate heavy rainfall. Extremely heavy showers and snowfall is shown by triangular lines. Fog or mist is represented by three to four straight horizontal lines. Triangular signs are mostly indicative of violent rain, and if they are accompanied by other extensions as shown in the following illustrations, they indicate showers with snow and hail, or rain with sleet occurrence. These symbols differ in appearance and positioning, depending on the format in which they are viewed; the most stylized ones can be seen on the latest gadgets. The four dots that indicate heavy rainfall might be placed adjacently, or even in a closed loop form.
One more characteristic of these signs is that they can be combined with various other basic symbols that depict weather. For example, if the fog symbol of three horizontal, parallel lines is drawn in front of the sun weather symbol, one can interpret it as being partly foggy or fog with mild sunlight. If sun and rain droplets are shown together, it means that rain is precipitating along with low-intensity sunlight.
Wind Speed and Direction
One of the most simplest signs, wind currents, are represented as lines drawn with long or short extensions called barbs. The least intense ones are shown by a circular symbol, and may have a speed between 0 – 5 knots. A short extension means that an additional velocity of 5 knots is present, whereas, a long extension indicates additional velocity of 10 knots. A triangular barb indicates a speed of 50 knots. The open end of the line tells us the direction towards which the currents are flowing. A knot is a measuring unit of wind current speed, and 1 knot equals approximately 1.15 miles per hour. Barbs are always written in a progressive manner, i.e., ones with the highest value are written near the end, while the lowest one is on the middle portion of the line.
If a line is originating from the south straight upwards, it means that the wind is flowing in the northern direction. If this wind current is shown with 2 short and long extensions each, along with a triangular point, it can be said that the wind is blowing at a speed of 80 knots. If two lines are present, it indicates two separate currents are passing through an area with different intensities.
Signs and Symbols on a Weather Map
The isobars (lines joining equal air pressure areas) and related weather fronts are shown spread across the United States. Also represented are the high and low pressure regions, along with the pressure values written below the signs. In the western half, the large blue-colored portion indicates a cold air mass above those parts, and the Northeast and Northwest coastal regions show the formation of occluded fronts (pink boundaries). The red lines with semicircular points are called hot fronts, while the blue lines with triangular points are called cold fronts.
Disclaimer: The map illustrated above is only for reference purposes, and is not related to any actual measured data.
Weather symbols work in the manner of shorthand language. Hence, maximum climatic data can be written using minimum representations. The signs vary continuously, depending on the changing weather-factors. All weather research stations situated at different places of our planet share the generated real-time data with every other station for better interpretations.
