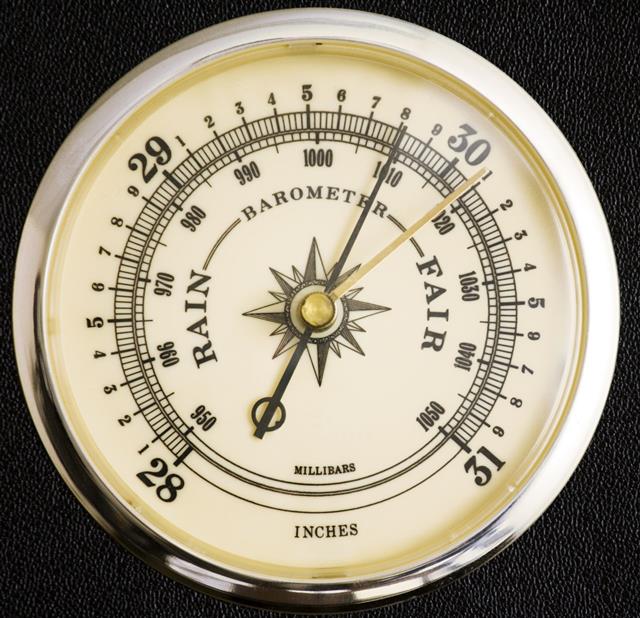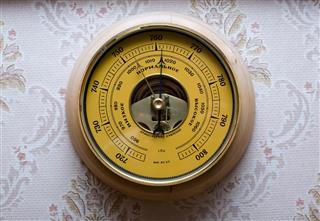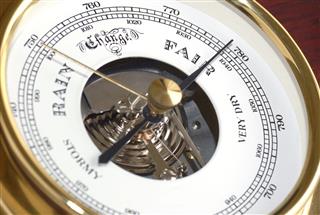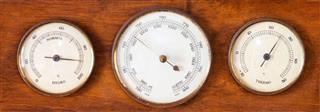
Thanks to the advent of aneroid barometers for home use, weather forecasting in no more restricted to news channels and newspapers. Now it’s possible to get the barometric pressure readings for your area on your own and interpret them to see what the weather has in store for you.
Atmospheric pressure, i.e., the pressure exerted by the air, is one of the most important attributes of weather forecasting. It helps us analyze the surface weather and find surface troughs and pressure systems prevailing on the planet. Both high pressure and low pressure are associated with certain weather conditions. You can easily predict these conditions if you are well-versed with the basics of barometric pressure readings.
How to Interpret Barometric Pressure Readings
Though the international meteorological unit of pressure is the hectopascal (hPa), you will notice that the atmospheric pressure is expressed in inches, i.e., the ‘inches of mercury’ (inHg or “Hg), on the dials of most of the modern barometers. The pressure readings for an area are mostly in the range of 29.70 and 30.20 inHg, with 29.92 inHg being the average pressure at the sea level. Most of the barometers today have the weather conditions for the specific range highlighted on the dial itself.
A reading of 29.92 inHg indicates a pressure of 101300 pascals or 1013 millibars (mb). This is the standard atmospheric pressure at 45° latitude at the standard elevation, i.e., the sea level. (The millibars unit is important because it is widely used to express atmospheric pressure on the weather maps.) While a reading above 29.92 mark indicates approaching high pressure air mass, reading below this mark is a sign of low pressure conditions.
The Altitude Factor
As the atmospheric pressure decreases with altitude, you have to adjust the barometer to your local setting in order to get the correct reading for your area. While most of the barometers can be adjusted to altitude, there may be a few exceptions. In such a case, you will have to calculate and apply the altitude correction manually. The rule of the thumb is to subtract .06 inches for every 50-feet altitude gained. When buying a barometer, you should also take into consideration its working altitude range, as some models in production today come with a limited range of sensitivity.
While the number is definitely important, even more important is the trend of the readings. A sudden drop in the pressure reading is usually a sign of approaching rough weather. Likewise, a sudden rise in the reading is a sign of clear weather. When the atmospheric pressure is high, the density of the air tends to increase, which in turn, makes the air fall and curbs cloud formation. In stark contrast to this, during the low pressure conditions, the column of air rises and results in formation of clouds. As the air moves from the high pressure area to the low pressure area, it invariably contributes to wind velocity and therefore, the formation of low pressure area is considered a sign of approaching storm.
A Brief History

The barometer was invented by Evangelista Torricelli, an Italian physicist, in 1643. (The word ‘barometer’ is derived from the combination of Greek words, ‘baros’, meaning weight, and ‘metron’, meaning measure.) Torricelli’s barometer, or the Torricelli’s tube that it is popularly referred to as, was a meter-long inverted glass tube which was filled with mercury. He observed that the level of mercury in the tube fluctuated on a day-to-day basis as the weather conditions changed.
Torricelli questioned the traditional belief that the air did not have lateral weight. He went on to propose that the air did have weight and it was ‘this’ weight that held the column of air up. Torricelli’s experiment was by and large based on the observations of his teacher and friend, Galileo. Over the course of the experiment, he realized that the use of a liquid which was heavier than the water would make the task of measuring air pressure even easier and decided to go with mercury, which was 14 times heavier than water.
Torricelli’s experiments were perfected by Blaise Pascal and Pierre Petit in 1646. In fact, it was Blaise Pascal who ascertained the fact that the air did have lateral weight by showing that the mercury barometer reading decreased with the increase in altitude. While Torricelli invented the mercury barometer, it was Lucien Vidie, a French scientist, who invented the aneroid barometer in 1843.
So the next time you see a weather map flashing on your television screen, with all those contours, peaks, and valleys, which seemed confusing until today, you will get a better understanding of the concept. These contours on the weather map basically give you an idea of the prevailing pressure system, with the innermost contour line indicating the center of the pressure system — the low pressure area that you need to look out for.
